24. Visualizing Your Tree
Visualizing a Decision Tree
Once we have created a decision tree using sklearn, we can easily visualize it by exporting the tree in Graphviz format, using Graphviz open source graph visualization software.
export_graphviz
Use
sklearn.tree.export_graphviz()
to export the tree into DOT format.
DOT
is GraphViz's text file format. It includes human-readable syntax that describes the appearance of the tree graph, including the content of subtrees and the appearance of nodes (i.e. color, width, label).
So for example, assume
model
is an instance of
DecisionTreeClassifier()
, and you've already called
model.fit()
. Then export to DOT format as follows:
dot_data = export_graphviz(model)There are a lot of options you can specify at this step, which you can explore in the documentation here . In particular, you can save the data to a file, you can specify whether and how to label the nodes, and you can rotate the tree.
graphviz.Source
To render a ready-made DOT source code string, create a
Source
object holding your DOT string.
from graphviz import Source
graph = graphviz.Source(dot_data)
Then, display the graph directly in the Jupyter notebook:
graphExample
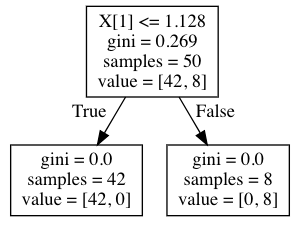
So, for example, if we create the following small dataset,
rng = np.random.RandomState(0)
X = rng.normal(size=(50, 2))
and set a target variable, y , equal to 0 by default, and equal to 1 if X_1 > 1.2 ,
y = np.zeros(X.shape[0], dtype=np.int)
y[X[:, 1] > 1.2] = 1
and fit a tree to it,
tree = DecisionTreeClassifier().fit(X, y)we can run the following code,
from sklearn.tree import export_graphviz
from graphviz import Source

treedot = export_graphviz(tree, out_file=None)
treegraph = Source(treedot)
treegraph
and we'll then see the following: